
Running a YouTube channel should not rely on guesswork alone. This guide explains how to read each tab in YouTube Studio Analytics, which metrics matter most, and how to choose third-party tools such as TubeBuddy and VidIQ.
Content is essential when running a YouTube channel, but ignoring data completely is like driving with your eyes closed. YouTube Analytics is the official free analytics dashboard that tells you who your viewers are, where they come from, where they stop watching, and which content drives subscriptions and revenue. Learning to read this data is more effective than blindly copying other creators' topics.
Where can you find YouTube Analytics?
Analytics is built into YouTube Studio (the creator dashboard). Sign in to your YouTube account → click your profile picture → open YouTube Studio → choose “Analytics” from the left menu. You will see the full data dashboard, divided into tabs such as “Overview,” “Engagement,” “Audience,” and “Revenue.”

What should you look at in each of the four tabs?
Overview
This is the “dashboard” for channel performance. It brings together watch time, average view duration, views, and subscriber changes. It also includes “Typical performance” comparisons (current data vs. your channel’s historical average) and “Top content” (the most popular videos in the past 28 days). After publishing a new video, you can also use the real-time report to check early performance and traffic sources.
Engagement
The main focus is watch time and audience retention—the metrics that best show whether your content keeps people watching. You can also see engagement data such as likes/dislikes, comments, and shares. If the retention curve drops sharply in the middle, that section likely needs improvement; if likes and shares are high but comments are low, you can design discussion prompts to encourage interaction.
Audience
This tab answers “Who are my viewers?” It shows age and gender, geographic location, viewing devices, returning/new viewer ratios, when your viewers are online, and which other channels they watch. Use this data to decide publishing times, whether to create localized content, and which channels may be useful collaboration references.
Revenue
For channels that have joined a monetization program, this tab shows estimated revenue, contributions from different ad types (including CPM/CPC), revenue from channel memberships and Super Chat, and earnings generated by YouTube Premium views. The data helps you understand which types of content earn more, but revenue figures should be based on YouTube’s official dashboard.
Which metrics matter most?
For most channels, start with these four:
- Watch time / average view duration: a direct reflection of retention quality and one of the signals most closely watched by recommendation systems;
- Audience retention: helps you judge whether the opening hook works, the pacing is right, and the middle drags;
- Click-through rate (CTR, found under “Traffic source”): measures whether your title and thumbnail are attractive;
- Subscription conversion and returning-viewer ratio: shows whether your content brings only “one-off traffic” or can build a lasting audience.
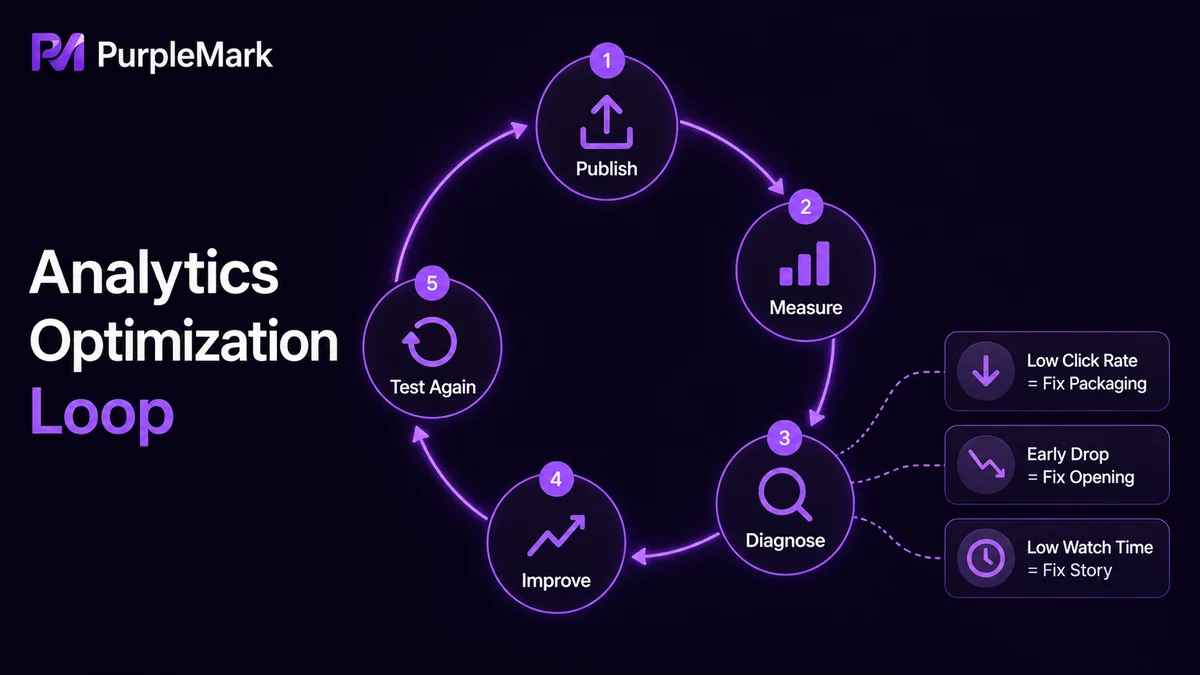
There is no single ideal value for every metric. The key is to create a loop of “publish video → review data → adjust → validate again.” If you publish frequently, check daily; for long-term strategy, a weekly or monthly review is usually enough.
Common third-party YouTube analytics tools
The official dashboard is enough for many needs, but third-party tools can help when you need keyword research, competitor benchmarking, or bulk optimization:
- TubeBuddy: a browser extension covering keyword research, video SEO, publishing planning, and A/B testing (title/description/thumbnail combinations), with free and paid versions;
- VidIQ: also a browser extension, providing views, subscriptions, popularity rankings, traffic sources, and SEO suggestions. The free version is suitable for beginners, while paid plans unlock competitor analysis and trend alerts;
- Cyfe: a multi-source data dashboard that goes beyond YouTube and brings social media, marketing, and sales data into one interface, making it suitable for teams that need cross-platform reporting.
Tool versions and features change over time. Try the free version first, then decide whether to pay based on your needs (keywords, competitors, data integration). Always refer to the official site for current pricing.
Account and dashboard management for content teams
When a channel grows from a solo creator into a content team, responsibilities are usually divided: someone edits videos, someone handles publishing, and someone monitors data and comments. Keep in mind that YouTube channels and accounts are governed by platform rules. Team collaboration should be organized through YouTube’s official channel permissions system (for example, by adding manager roles), rather than sharing logins or registering multiple personal accounts to bypass rules.
When compliant with platform policies, teams that manage multiple brand channels or need to sign in separately to multiple dashboards (YouTube Studio, social platforms, analytics tools) can use PurpleMark to create separate browser environments for different roles or channels. This keeps login sessions and frequently used dashboards separate, while member permissions and activity records can clarify responsibilities. When several people maintain multiple channels, this helps reduce accidental sign-ins to the wrong account or session conflicts.
Frequently asked questions
Are free versions of these tools enough? For beginners, yes. The free versions of TubeBuddy and VidIQ cover tag suggestions, basic analytics, and SEO optimization; consider paid versions later if you need competitor benchmarking or bulk processing.
How often should I review the data? There is no standard answer. If you publish frequently, check real-time and recent 7-day data more often; for topic planning and long-term strategy, review weekly or monthly.
Why does my video have many views but few subscribers? High views suggest the title and thumbnail are working, while low subscriptions mean the content may not give viewers a strong reason to keep following the channel. Reinforce your channel positioning in the video or create more serialized content to encourage subscriptions.
Do third-party tools show the same data as YouTube? Generally yes, but measurement methods may differ. For important decisions, use official YouTube Studio data as the primary source. Third-party tools are better suited to trend comparisons and competitor research.


